Stat_Line makes verbose TrackMan data easy to interpret. Build professional, coach-ready reports in minutes.
Pitching and batting, with quick view on the website, downloadable PDFs, and custom branding options.
Scroll to see the full scale of raw TrackMan output
Loading…
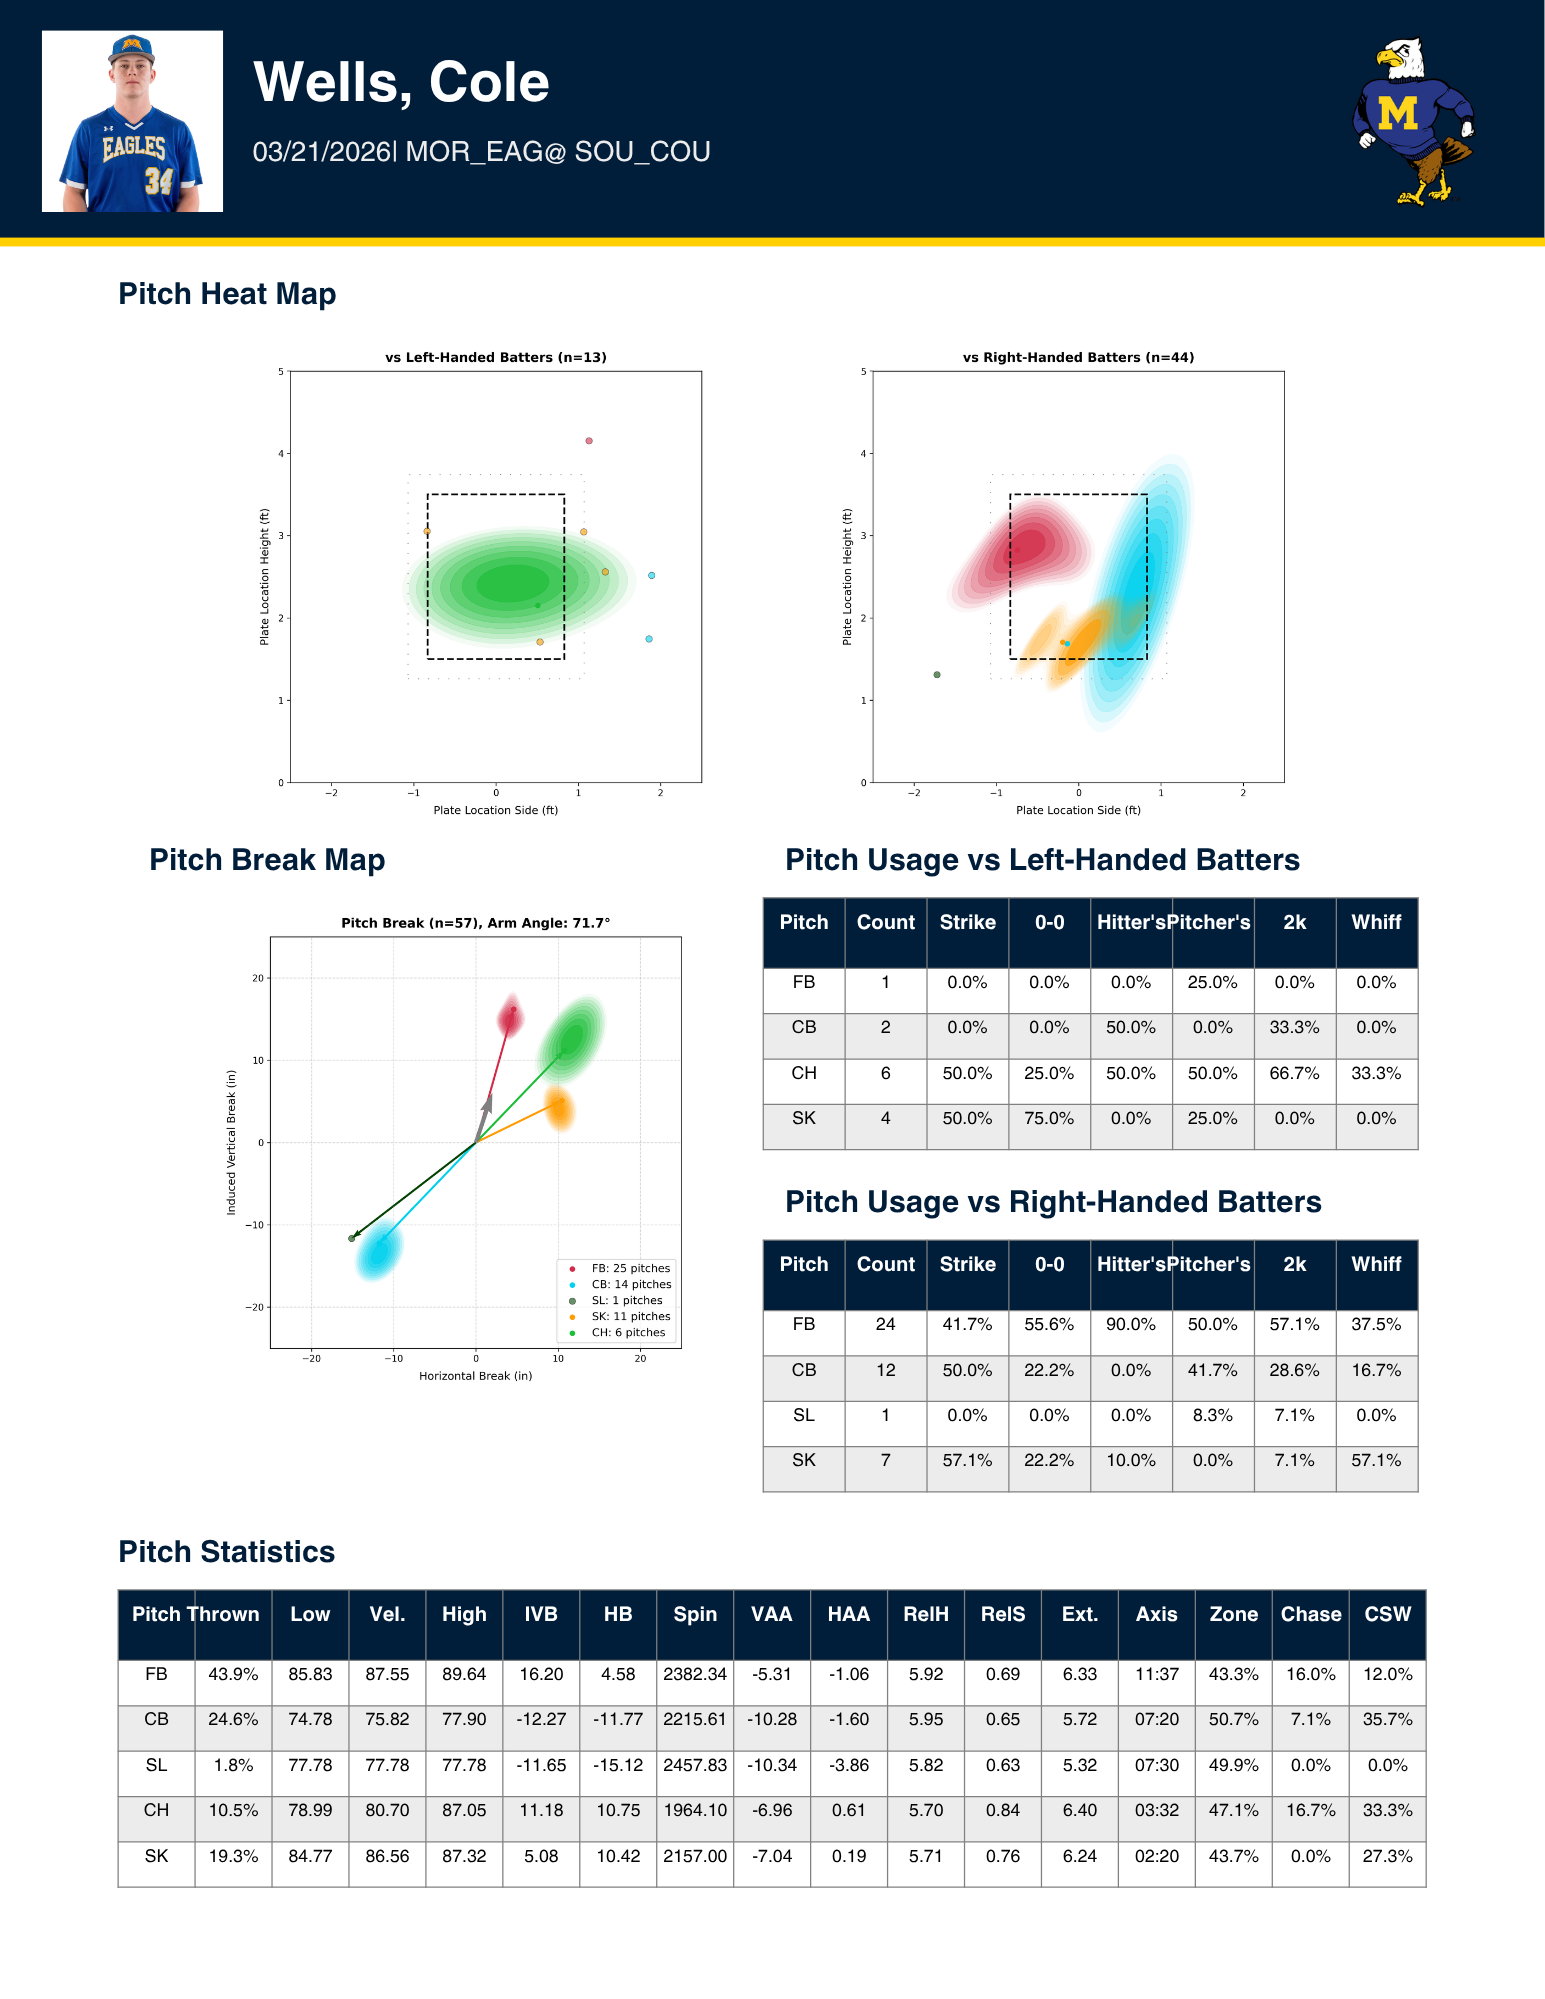
Pitcher report — heatmaps, movement charts and pitch-type tables
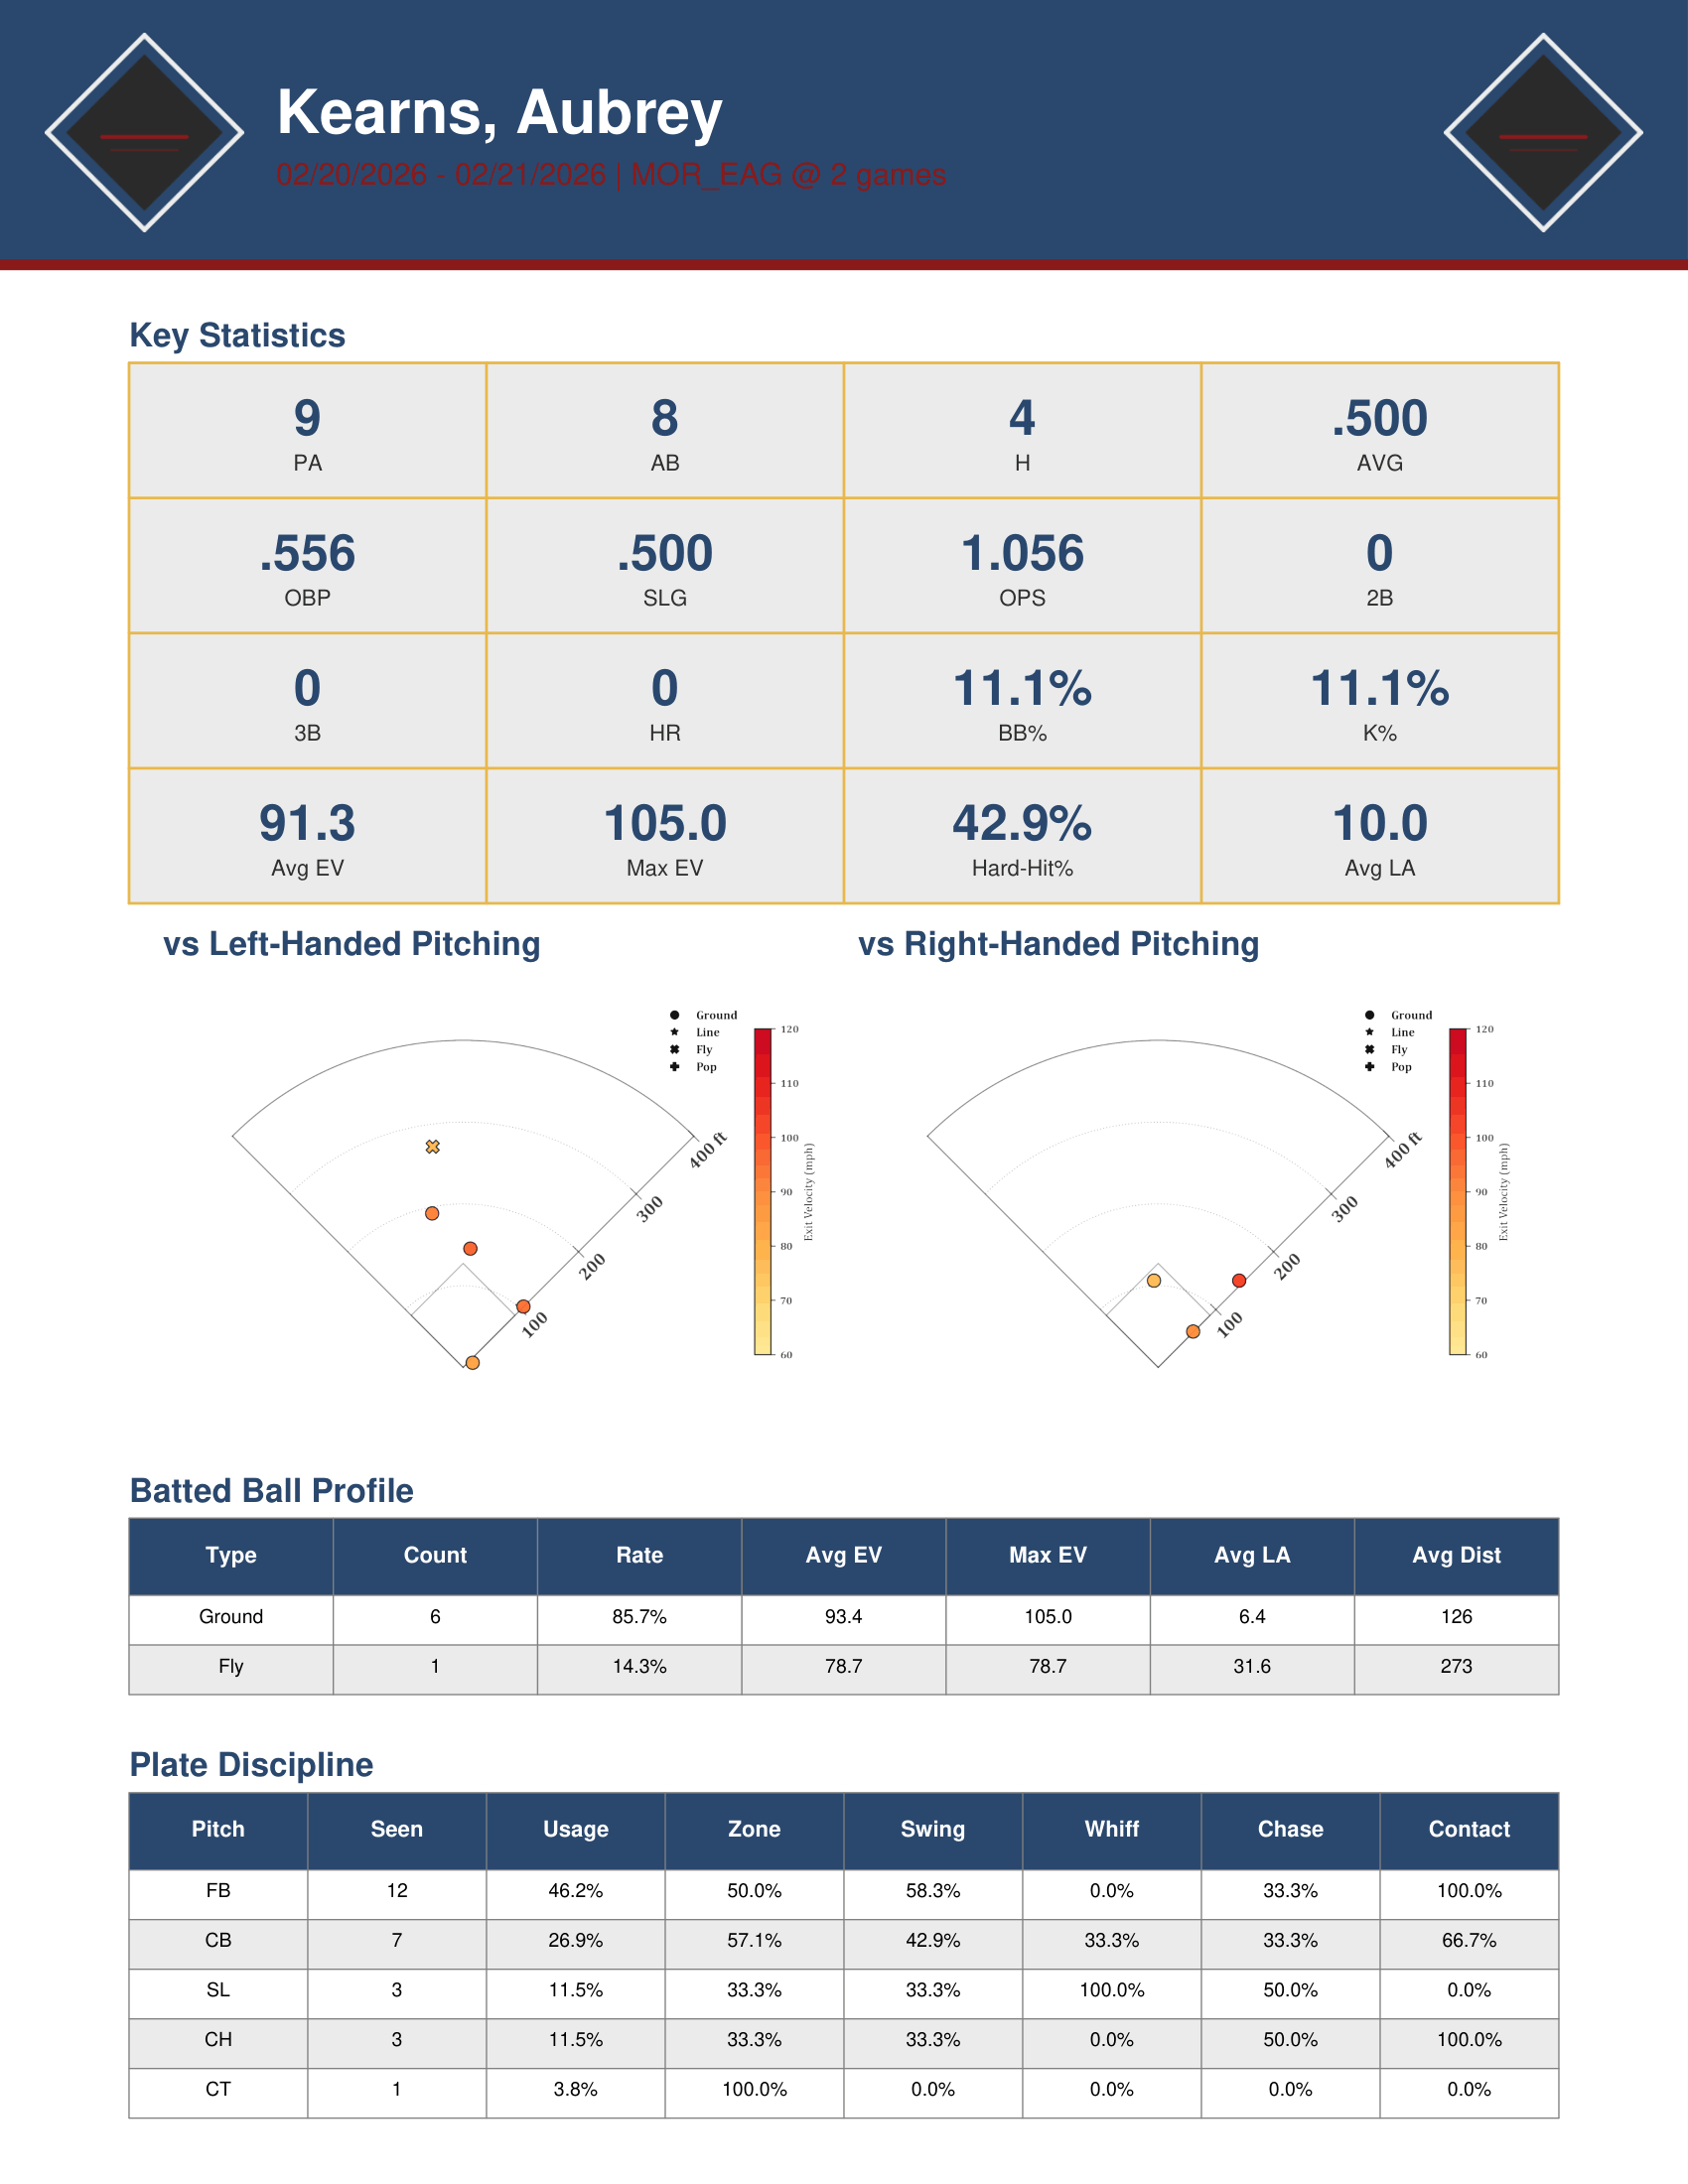
Batter report — date-ranged, with spray charts and plate discipline
Turn a raw TrackMan export into branded, coach-ready reports in about the time it takes to walk from the field to the office.
Stat_Line is a hosted, school-scoped web application. Your staff uploads a game file; the app returns pitch heat maps, movement profiles, hitter spray charts, plate-discipline tables, and print-ready PDFs carrying your school's colors and logo. Data from one program is never visible to another.
Deployed on Railway with automated SSL.
What it does for your program
Turn a game file into a report before the bus leaves
A TrackMan export is thousands of rows nobody reads. Upload it and Stat_Line returns one row per pitch type, ranked by usage:
| Group | Columns |
|---|---|
| Usage | Thrown — share of total pitches |
| Velocity band | Low / Vel. / High — the range, not just the average, so you can see a tiring arm |
| Movement | IVB, HB — induced vertical and horizontal break |
| Spin | Spin rate and Axis — spin direction as a clock face |
| Approach | VAA, HAA — vertical and horizontal approach angle |
| Release | RelH, RelS, Ext. — height, side, and extension |
| Results | Zone%, Chase%, CSW% |
Alongside the table: heat maps split by batter handedness, and a break map showing the whole arsenal at a glance with the pitcher's arm angle computed from it. Every pitcher gets an individual PDF, plus one merged file for the whole staff.
You also get pitch usage broken out separately against left- and right-handed batters, which is where platoon problems show up first.
You can point the same file at the other dugout. Flip to Opponent and the app builds the identical report for the arms your hitters are about to face.
Scout hitters across a time frame, not just a game
One game tells you very little about a hitter. The Batting page works across your saved game archive: choose a hitter and a date range, and the report is built from every game in that window.
- Spray charts split by pitcher handedness — where the ball actually lands, sized by exit velocity and shaped by batted-ball type, so pull tendencies and platoon splits are visible at a glance
- Slash line and batted-ball profile — AVG / OBP / SLG / OPS, hard-hit rate, average and max exit velocity, launch angle, ground-ball and fly-ball mix
- Plate discipline by pitch type — swing, whiff, chase, and contact rates, so you can see which pitch is actually beating a hitter
Point it at opponents to build a defensive positioning card, or at your own roster to track a swing change over the back half of a season.
Track development over a season, not just a start
Saved games roll into a team dashboard: per-pitcher averages across every outing, situational splits for lead-off and two-out effectiveness, and a team-wide overview table. Anything on the dashboard exports to Excel for staff who would rather work in a spreadsheet.
Reports that look like they came from your program
Every PDF and every page carries your colors, your logo, and your players' photos. Upload a roster CSV, drop in headshots individually or in bulk, and set your palette from the subscription page with a live preview before you commit. Reports you hand a recruit or a parent look like your program produced them, because it did.
Built for a staff, not a single laptop
- Multiple accounts per school with admin and member roles
- Self-service signup — register the school, subscribe, and create the first admin account without waiting on anyone
- Domain-restricted registration, so only people with a school email address can join your program
- Every query is scoped to your school. Cross-program data access is prevented at the query layer and covered by a dedicated isolation test suite.
Works with the data you already have
Stat_Line reads the TrackMan export as-is — .csv, .xlsx, or .xls, no reformatting. Uploads are validated on extension, MIME type, file signature, and column presence before anything is processed, so a wrong file gets a clear error rather than a broken report. Pitchers found in a game file but missing from your roster are added automatically.
How a season runs
| Stage | What your staff does |
|---|---|
| Setup, once | Register the school, subscribe, set colors and logo, upload the roster |
| After each game | Upload the TrackMan file, review the reports, click Save Game |
| Before a series | Upload the opponent's file with Opponent selected; build hitter reports over a date range |
| Through the season | Watch the dashboard trends; export to Excel or PDF as needed |
Save Game is the step that matters most. It persists the outing to your database and archives the raw file, which is what makes date-ranged hitting reports possible later. A game that is uploaded but never saved produces reports for that day only.
Access and subscriptions
Stat_Line is subscription-based, billed through Stripe Embedded Checkout.
Tables and statistics are always available. Charts — heat maps, break maps, and spray charts — require an active subscription. A lapsed subscription degrades the reports rather than locking you out: your numbers keep working.
Contact & Support
Questions about the product, your subscription, or TrackMan integration? Get in touch directly.


